Let me ask you a simple question. If you could own one of two similar businesses, each producing equal margin volume but one of them carried greater inventory, which would you choose? Of course you would choose the business with less inventory.
It’s bizarre that there is such wide variation in inventory levels among comparable retail furniture operations. The direct result is that the higher inventory businesses experience lower profits and less cash flow than their competition. This in turn limits sales growth due to fewer funds being available for re-investment.
Operations that carry less inventory at the same margin volume minimize their operating expenses due to lower carrying costs in terms of storage, damages, machinery, interest, and people to maintain that inventory. Being leaner allows them to maximize cash due to lower trade payables and greater profit. These operations tend to have higher sales growth rates too. This is due to a consistently higher open-to-buy and money available for growth investment. Best seller stock-outs can be minimized and new merchandise can be tested more often than operations that have their hands tied due to bulging over-stock.
Whatever the situation, there is always room for improvement, which begins with tracking. To begin tracking, a metric must be used. Total inventory dollars is not a metric. That means nothing on its own. Inventory must be compared against something. This is the purpose of GMROI. Gross Margin Return on Inventory compares your inventory to the margin dollars that it produces. The GMROI formula is simple: GMROI = Gross Margin Dollars annualized divided by average inventory on hand.
Here is how to use GMROI as a metric to improve performance:
1. Track GMROI for your entire operation on a monthly basis:
You do this to get an overall picture of how your merchandise is performing at a particular point in time. Suppose it is April third and you set aside a couple hours to review your progress and to strategize. Take your sales for the past three months (Jan 1 to March 31) and subtract your landed cost. That will give you your gross margin dollars. Now annualize that number over one year by taking your gross margin dollars divided by three and multiplied by 12 months. For example, if sales were $4 million for three months and landed cost was $2.2 million annualized, GM would be $7.2 million. Now figure average inventory by taking the inventory at the start of the period and at the end of the period and dividing it by two. (You can average over one month or several months as long as you are consistent in your formula.) For example if inventory began with $3.49 million and ended with $3.57 million, the average inventory that you carried would be $3.53 million.
In this example, your GMROI is $2.04 =($7.2/$3.53). That means that $1 in inventory generated a return of $2.04. Whatever your number is, the most important thing is that you know it. And, that you are tracking it so you can improve it!
(Note: Although most good inventory management systems can do the calculations for you, it is important that you understand how to do the math in your sleep. That is one thing that separates inventory management professionals from novices.)
2. Track GMROI for all vendors sorted by sales volume.
List them underneath their respective categories. The previous step tells you where you are overall. Step two is used to help hone in on where improvements are needed. All merchandise belongs to two families: a Category and a Vendor. In full line Furniture Retail, for example, there are roughly 12 primary merchandise categories. (For example: Upholstery, Occasional, Leather, Motion, Dinette, Dining Room, Bedroom, Mattress, Office, Youth, Accessory, Rugs). First, it is important to know your GMROI for each category. This allows you to spot which categories are pulling your overall GMROI up or down. By doing this you will likely see that some categories such as mattresses are consistently higher than others such as occasional. You can clearly see where your money is coming from and where it is going.
 Example:
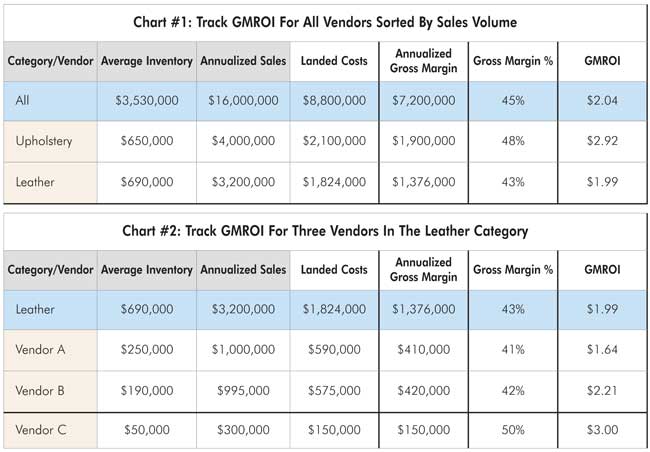
In Chart #1 above, two product categories are compared with the overall annualized results. Together, Upholstery and Leather make up 45% of the entire sales volume. If these areas can be improved, this will have a significant impact on the entire businesses’ cash flow. Upholstery is definitely out-performing Leather. In Upholstery there is less inventory carried, a higher sales volume produced, at a higher margin. Overall Upholstery GMROI is $2.92 compared with the average at $2.04 and Leather at $1.99. This business should take steps to improve Leather GMROI by creating a system that promotes leaner, faster turning inventory at a higher GM, thereby contributing to an increase in overall GMROI.
Now, under each category list the vendors that make up that category . When you list them, sort them by their sales volume. This allows you to see the most important vendors that influence the results at the top. In Chart #2 above, you can see how this might look using three vendors in the Leather category.
The big observation here is that the top selling vendor, Vendor A, actually is pulling the category down. It has a GMROI of $1.64 compared with the category average of $1.99. As a comparison, Vendor B does a similar sales volume but carries $60,000 less in inventory on average. Vendor C produces the highest GMROI at $3 because it requires a minimal amount of investment and the salespeople are selling it at 50% gross margin.
3. Determine areas of strengths, averages, and weaknesses:
When you perform analysis on your own data, clearly identify categories in terms of strong, average, and weak performers in terms of GMROI.
Using the examples above, note that areas of strength in Upholstery and for Leather Vendor C. If this were your data you might find that Leather Vendor B is average and Leather Vendor A is one that needs attention. This type of analysis will help you focus on the areas of your merchandise that will make the biggest and fastest improvement in your business.
4. Define improvement strategy:
This is the step where you must set the overall goals for your merchandise performance improvements. First, assign a project leader for your team. Then, periodically review the progress each month to determine if the strategy is working or whether it needs to be fine-tuned. A big problem that some businesses have is that they see what needs to be done, but they don’t manage the process, so change is slow. If your improvement strategy is important to you, then you must check your results often.
This example shows a big opportunity. The obvious area to focus on is improving Leather Vendor A. The general strategy will be to increase GMROI to above the current store average, to a 2.05, within 3 months. The project will be assigned to the Head Buyer and Sales Manager to manage. They will reduce inventory levels and work on increasing gross margins.
5. Execute improvement tactics:
Let’s continue to use Leather Vendor A and get more specific about what needs to happen for the strategy to be executed. This hinges on answering the question: How can we go about reducing the inventory and increasing gross margin without harming sales?
Here are some tactics:
- Set an open-to-buy for new merchandise trials. Do not purchase new inventory until this area of the business is at the desired merchandise $ level for sales.
- Execute a price markdown or inventory aging system to highlight stagnate inventory in the line-up. Use various actions to sell old inventory. This may include spiffing the sale at a higher commission percent.
- Ensure that all merchandise is displayed and continues to be displayed quickly.
- Look at scheduling deliveries faster with a cross-docking system.
- Review best seller and special order pricing for hidden margin opportunities. There are often micro pricing adjustments that can be made that add up to quite large profits.
6. Return to step 1:
So, what would happen in this example if the business managed to successfully execute a strategy to grow the GMROI of Leather Vendor A to 2.05? Refer to charts titled GMROI For Vendor A Before & After on page 14 to see one possibility that is achievable:
- The result of funds freed up from inventory is $26,000 on average.
- The result of extra margin dollars produced is $50,000 extra per year.
The effort is worth it. This is just one area that, if improved, will have a significant impact. Multiply this over many areas over time and the combined results of a higher GMROI will be massive.
It needs to be noted that GMROI tracking, strategizing and improvement execution does not end. Best practice companies go through the process of improvement on a continual bases. Therefore, this final step just takes you back to step 1 for you to continue the never ending cycle of inventory management.
Every operation has areas of strengths, averages and weaknesses. Every operation has room to improve. The willingness to use GMROI as a management and operational tool is one factor that separates the best performing stores from their peers. Set aside some time each month to review your results and develop a strategy for improvement using GMROI as your driver for success.