There is only one way to be successful in business. It’s to Profit. There is only one way to build cash in the bank. It’s to Profit. And, there is only one way to grow your business. It’s to Profit.
Profitability sometimes takes a back seat to sales. It should not. Sales volume is a critical and necessary part of the profit equation, but it is just a part. Cash is only accumulated through the consistent spread that is made after the sale of an asset. That spread, or bottom line, needs to be in the 7%+ area every year to nicely accumulate cash. Profit fuels growth. It is the driver of even higher sales and higher profit volume levels. This is because growth comes from investing in great people, inventory, facilities, systems, training, and marketing. The least expensive and least risky capital for this growth investment comes from equity in the business. And equity comes from either profit or an investor’s pocket. The alternate source of funds for growth is debt. I think you will agree that it is far more enjoyable to use profit to perpetuate business growth, rather than paying off loans.
In the real world of retail, I’ve seen thousands of financial statements: the great, the so-so, and the abysmal. One commonality is that businesses always have room for improvement. And also, the smallest improvements can have massive impacts on profitability. This article will cover the basics of how to analyze one of the three critical financial statements: the Profit and Loss (the other two not presented are the Balance Sheet and the Statement of Cash Flow).
CASE STUDY
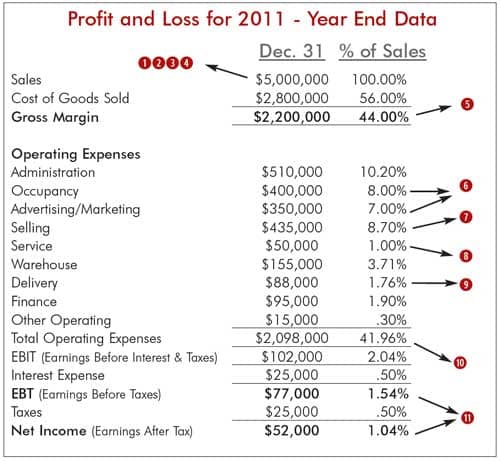
Below is a sample furniture store P&L. This version of the Profit and Loss statement called a common-sized statement, enables analysis with past periods, with peer companies for performance groups, and with the industry as a whole
Company Background
- Family owned and operated.
- Full line furniture, no electronics or appliances.
- One store operation with one detached warehouse.
- Family owns buildings separately and business pays rent.
- 25,000 square foot showroom.
- Eight salespeople, one sales manager.
- Average sale = $1,350; traffic count for 2011 = 18,519; close rate = 20%.
- $1,000,000 average inventory at cost.
- Vendor merchandising - mid to upper.
- Special order percentage = 50%.
- Budgeted sales 2011: $5.26 Million.
Analysis & Ratios (Reference Red Numbers on P&L Above)
1. Sales to plan? 95%=($5.26M/ $5M). Sales fell short of budget by $260,000. This company needs to look for specific reasons why this occurred. Was the plan too ambitious? Were there operational factors? What can be done differently for 2012.
2. Sales per square foot? $200 = ($5M/25,000). This is a very average number. Many special order type operations selling medium to high end merchandise have results in the $400 plus range. This company needs to investigate merchandising mix, traffic counts, and the effectiveness of its sales force.
3. Number of customers per salesperson per monthly average? 193 = (18,519/12/8). This number indicates that the business is understaffed and can make improvements in sales management. Special order type operations that focus on sketching, room planning, and home design operate in the area of 100-140. This alone could be what caused sales to underperform to plan.
4. Inventory to sales? 20% = ($1M/ $5M). This business is on the verge of being over-inventoried. Efficient operations will typically hold an average inventory of 15% of sales. That accounts for $250,000 less in stagnate asset purchases. Inefficiency also contributes to lower sales numbers and a higher expense structure. This company should implement better inventory management systems. Examples are open to buy purchasing systems, merchandising systems, and mark down systems.
5. Gross margin is 44% of sales. This company is outright throwing away 3-6 percentage points. This could be rectified through a variety of methods which may include: special order pricing guidelines; better and more creative price pointing; a quicker turning mark down system; variable commissions on gross margin; improving warranty, fabric protection, and mattress pad conversions; more appropriate cost multipliers on vendors and categories; package and group pricing.
Underperforming margins are the easiest problem to fix unless the operation is extremely over inventoried (25% Inventory/Sales).
6. The occupancy and advertising expense combined percent of sales? 15% = (8%+7%). Look at these two figures together because higher occupancy cost correlates positively with high traffic locations that require less advertising expense. Conversely, a destination location requires a greater advertising expense to pull people in. Whatever the situation, the combination of the two can never go above 15% of sales. That usually indicates that a retail operation is not viable unless gross margins are 55%. This operation is on the cusp. Details of the rent paid to the owners and marketing expenses need to be evaluated if this current sales level continues.
7. Are proper selling incentives and pay for performance programs in place? Almost 9% of sales is okay if the business is hitting sales targets and producing a healthy bottom line. This business is not. The company should consider putting a program in place that leads to higher margins and a faster turning inventory.
8. Service percent of sales? 1%. This seems at least half a point high. Are vendor credits getting processed? Perhaps there are excess damages because of higher inventory levels or some other operational issue. They should investigate.
9. Delivery percent of sales? 1.76%. It’s a good policy to offset delivery charges against delivery expenses. If this is being done, then the charges will sometimes cover the expenses. There may be opportunity of up to 1.5% in the delivery department through either charging proper setup and delivery fees or utilizing delivery staff and resources better.
10. Total operating costs as percent of sales? 41.96%. At 44% gross margin, this leaves only 2.04% in profitability before interest expense and taxes. That’s not much to work with. 37% is an EBIT (earnings before interest and taxes) that operations should strive to achieve.
11. Earnings before taxes (EBT)? 1.54%. As far as the industry is concerned, this is low to low average profitability. Growth will be difficult at this level as there is only $52,000 in cash that is generated from operations that will go into equity for the year after taxes are paid.
Consistently operating at this level can cause liquidity issues in the short term and solvency issues in the long run if there is ever a sudden down turn.
The numbers used in this article are similar to a real furniture operation. In the past year I’ve seen businesses like this that have improved to a double digit bottom line before taxes.
You might ask, “So, what would happen to the bottom line of this company if the right improvements were made?”
Great question! First, they need to be 100% committed and invest in the proper help. They could then improve their selling system to reach their sales target, take inventory management actions to get gross margin to 47%, and make slight adjustments to their merchandising, service, and delivery departments. Doing this would produce an Earnings Before Taxes of over 13%, or more than $700,000. The after tax net income would be close to 9%, or over $460,000! That’s why it is worth it to “Think Profit!”