If you are a #3 type retailer who wants to continuously improve, but needs to know where to start, this article is for you!
When I travel around the world consulting with retailers, I often encounter three types of operations:
1. Those that take decisive actions to grow their sales volume, margins and profitability simultaneously.
2. Those that are happy to operate in the averages, control costs and take little risk.
3. Those that react in real time to problems and opportunities, but have aspirations for higher profits and ongoing improvement.
It is obvious that the first type of operation that has a handle on its business model will almost always be in the best competitive position. But which type of operation out of the remaining two will be second best? It's my experience that the reactive operation (#3) that has aspirations for improvement is in a better position than an operation that is both risk and change averse.
Chaotic businesses can and do become highly profitable. What's required is that store managers start to focus on important tasks instead of day-to-day distractions. In contrast, retailers whose business models focus mainly on cost-cutting, rarely stand the test of time.
So, if you are a #3 type home furnishings retailer who aspires to continuously improve but need help focusing on what to improve and where to start, this article is for you. I’m speaking to those who wish to be decisive and take action.
Inventory & Selling
The two biggest elements of retail success are inventory and selling.
In 2015 and 2016, I conducted an industry-wide survey of operational and financial numbers to formulate key retail performance metrics. In 2017, I tracked similar data from furniture retailers across North America. The 2017 findings are consistent with those of years past. This article includes several metrics that you can use as benchmarks for your performance. Compare them with your operating numbers. The idea is to look at where your operation falls short. Only then can you focus on closing the gap by taking decisive action to generate improvement.
Inventory Metric Observations
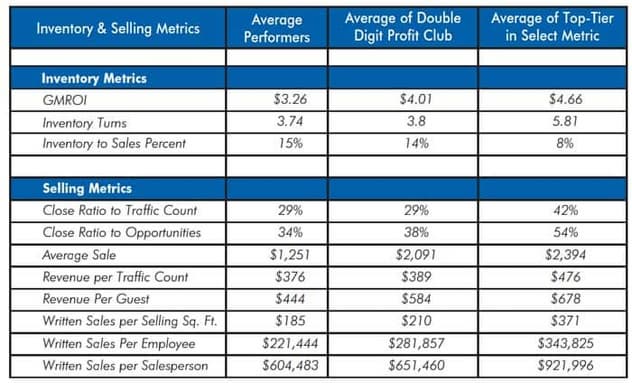
The observations tabulated on page 12 are expressed in three column groupings:
Average of all performers
- Average of double-digit (net income before tax) performers
- Average of top-tier performers (top 10 percent).
What follows are key takeaways about what is required to increase profits based on the inventory metrics collected in this study.
1. GMROI: To summarize, GMROI is annual sales minus cost of sales, divided by inventory (or annual gross margin dollars divided by your inventory). It is your single most important performance indicator, because maximizing the amount you produce after a sale, while minimizing the inventory investment, directly translates to more cash.
In the second column of the table, we see that the average of all of retail operations observed in 2017 produced a GMROI of $3.26. This means that for every dollar retailers invested in inventory, $3.26 in gross margin dollars were produced. This is what those operations on average had left over to pay for all their operating costs and to make a profit.
For example, if an operation has $1 million in inventory on average, and has a GMROI of $3.26, it will produce $3.26 million in gross margin dollars. This may sound like a lot, but an average operation only has about a five percent net income before tax, so this operation would have little left over to add to cash flow.
The third column of the table labeled "Double Digit Profit Club" lists GMROI for those operations that produced a net income above 10 percent before tax. These businesses produce an average GMROI of $4.01. That’s only a 27-cent difference. Not a lot, right? Wrong! That 27 cents is worth $270,000 in additional gross margin dollars for the same $1 million in inventory. If operating costs are exactly the same at two stores, one an average profit performer and the other a double digit profit performer, and they both have the same level of inventory, the high profit store will have an extra $270,000 going directly to the bottom line!
The third column displays the "Top-Tier" of businesses observed with respect to the metric. With GMROI, we see some companies reaching and exceeding $4.66. In fact, it is not uncommon to work with operations that keep this number above $6.
2. Turns: Inventory turns are similar to GMROI, except this metric takes annual landed cost of goods and divides it by inventory. If a company has a gross margin percentage of 50 percent, GMROI and turns will be equal.
Here we see that average operations turned inventory 3.74 times per year while the double-digit club produced a slightly faster turn at 3.8 times per year. The top operations turned considerably more than both, at 5.81 times.
Turns can also be expressed in terms of days to sell through inventory. Take 365 days and divide that by annual turns. If a retailer generates 3.8 turns, it takes 96 days to sell though its inventory. An operation turning inventory at 5.81 times will sell through its inventory in just 63 days, 33 fewer days.
3. Inventory to Sales: This is the percentage of inventory an operation carries in relation to its annual sales volume. The theory here is that if you can carry less inventory and sell more, profits and cash flow increase. This is mostly true, however, there is also a line between too much and not enough. In any inventory-carrying operation, a certain level of merchandise must be maintained or sales will be lost.
Depending on the individual business model, some operations will require more inventory, and some will require less. The important thing is that an operation understands its model, its optimal level of merchandise, and maintains inventory dollars at a comfortable level.
The table shows that the average inventory carried as a percent of sales was 15 percent. The double-digit club held 14 percent. Plenty of highly profitable stores hover around 20-25 percent, but their merchandise is usually at a higher average cost point.
Selling Metric Interpretations
4. Close Rate to Traffic and Opportunities: Close rate is important because it’s a productivity measure taking into account customer-salesperson engagements and the number of leads (traffic) produced. There are two types of leads we typically measure:
- Traffic: The number of customers in the store
- Opportunities: The number of customers engaged by salespeople.
Traffic and opportunities should be the same number, but in the real world, they seldom are. This is due to not having enough salespeople to cover traffic at peak times. For this reason, we measure both traffic and opportunity close rate. The difference between the two is missed opportunity, which is a measure of sales floor ineffectiveness.
In the table, "Close Rate on Traffic" is the same for both average and the double-digit profit club at 29 percent. "Close rate on Opportunities" is 38 percent for the double-digit profit performers and 34 percent for the average group. This could mean that the highly profitable companies are better at bringing customers to a conclusion. However, they may be understaffed, missing recording some traffic as opportunities.
Close rate is one part of the sales equation of Sales = Traffic (or Opportunities) x Close Rate x Average Sale. Each piece of the equation should be tracked and managed overall, by store, by critical department, for brick-and-mortar and online, by individual, and by sales teams.
5. Average Sale: This is a premier metric that should be constantly monitored and improved. It can vary significantly from one salesperson to the next and from one store to another. However, the averages do not tend to vary much from one merchandising style to the next. For example, contemporary showrooms have similar average sales to traditional showrooms. With that in mind, this metric and all the others presented are of value across all types of home furnishings and mattress operations.
Looking back at the chart you will see that the average performer's "average sale" is $1,251. The the double-digit profit club figure shown in column #3 is $2,091 and elite performers for this metric produced an average sale of $2,394.
There are many ways an operation can grow this number. My advice is to really dig into the details, then look for incremental improvements to create significant, lasting impacts.
6. Revenue per Traffic and per Guest: This is the value of each customer visit. It is used for marketing purposes as well as sales performance and coaching.
Similar to close rate, this metric is tracked for both Traffic and per Guest (Opportunity). You can use this metric to highlight the value of an extra opportunity. The average revenue for a guest listed in the second column is $444. So, for an average store, if 100 customers are missed over the period of one month. That can be seen as $44,400 (100 x $444) in lost business.
One big task for sales managers should be to bridge the gap between sales per traffic and sales per guest. Only then can they be more confident that all their customers are being served and that they are staffing appropriately.
For coaching purposes with individual salespeople, however, sales per guest is the metric sales managers should use because it is the actual number of customers salespeople documented they interacted with.
7. Written Sales per Selling Square Foot: This is used as a measure of retail space productivity.
Average performing stores produced $185 in sales per square foot (see the table). Our double-digit profit group produced $32 more, at $217. The top-tier for this metric came in at $371.
Let’s see how this metric can be used. Suppose a store has 35,000 square feet and an average of $185 written sales per selling square foot. Its annual volume would be $6.475 million ($185 x 35,000). If it had the average sales per square foot of a double-digit profit store, it would generate an additional $1.12 million ($32 x 35,000). Do you now think it might be worth looking into developing a strategy to move from column #2 in the table to column #4?
8. Written Sales/ Employee: With this metric, higher is not always better. An operation should seek the optimal number of total employees to serve its customers and support future business growth. That said, comparing against average and double-digit profit is important.
Average stores have written sales per employee of $221,444/person. The double-digit profit club produces more revenue with less people at $281,587/person.
So, for example, an operation that does $6.5 million in annual sales would operate with 23-30 people total if they were in the average to high-profit range.
9. Written Sales/ Salesperson: Retail furniture and bedding operations should staff to cover their high traffic times and their obtainable goal volume.
Again, a higher number here is not necessarily better. Finding a sweet spot to serve your customers to the desired satisfaction level will maximize your top line.
For this metric, average stores produced $604,483 per salesperson per year, while the double-digit profit club produced a bit more sales with less people at $651,460 per person. The metric shown in the chart for the "top tier" at $921,996 is too high in my opinion. It has been proven time and time again that top tier retailers can produce higher volume with more people and average-to-high profit per salesperson. Top salespeople’s performance are rarely affected by more salespeople. It holds true that most operations will usually produce $50,000-$60,000/salesperson/month.
As an example, an operation that does $6.5 million in annual sales would have 10 or 11 salespeople if it were average to high profit.
Conclusion
Many furniture store operations have pulled themselves out of huge debt to become cash flush. Good operators have become leaders in their categories and marketplace. It takes time, of course, but it is possible.
When working with the performance indicators presented here, develop your strategy and specific tactics for improvement. Commit to ongoing measurement, never-ending improvement, and adopt a CAN-DO attitude. Don’t go at it alone. Find partners in your industry that will motivate and strategize with you. Manage your two businesses: your present business and your future business.
Our 2017 Retail Observations, also looked at several financial metrics that can be obtained by emailing david.mcmahon@highjump.com.
Offer: For a limited time, David McMahon is offering retailers an Opportunity Analyzer. You can get a customized side-by-side comparison report with all of these metrics along with a useful one-on-one web meeting.